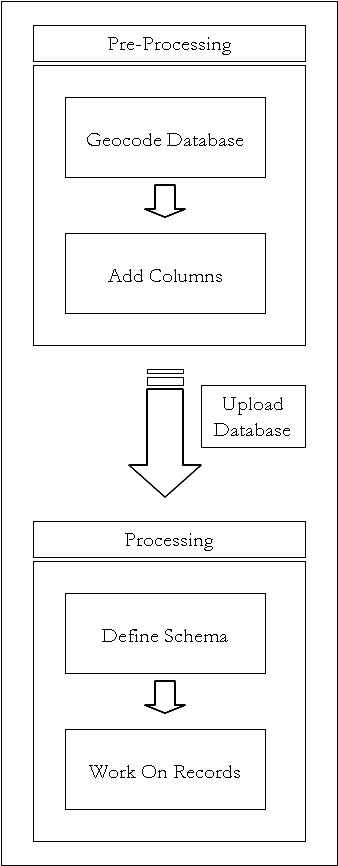
Overall processing workflow
The main processing workflow of using the Geocoding Correction Tool is
composed of two portions, pre-processing applied to the input database,
and the processing of the records. In the pre-processing phase, the database
is geocoded with a geocoder, and the required columns are added. This can be
done automatically with the Geocoding Service within the Web Toolset, or the
user can to do it themselves. In the processing phase, after the database is
uploaded, the schemas for the tables must be defined, i.e., the variable names,
locations and content for input and output within the uploaded databases need
to be identified to the system, and then the records can be worked on. The next figure
depicts the case where the user geocodes the data themselves and then uploads
it to the Web Toolset.
Database processing workflow
The general database processing workflow is depicted in the next figure. First the database is
chosen, then the table must be chosen and have its schema defined, then the qualities
to work on are selected, then the records are chosen, and finally each is processed.

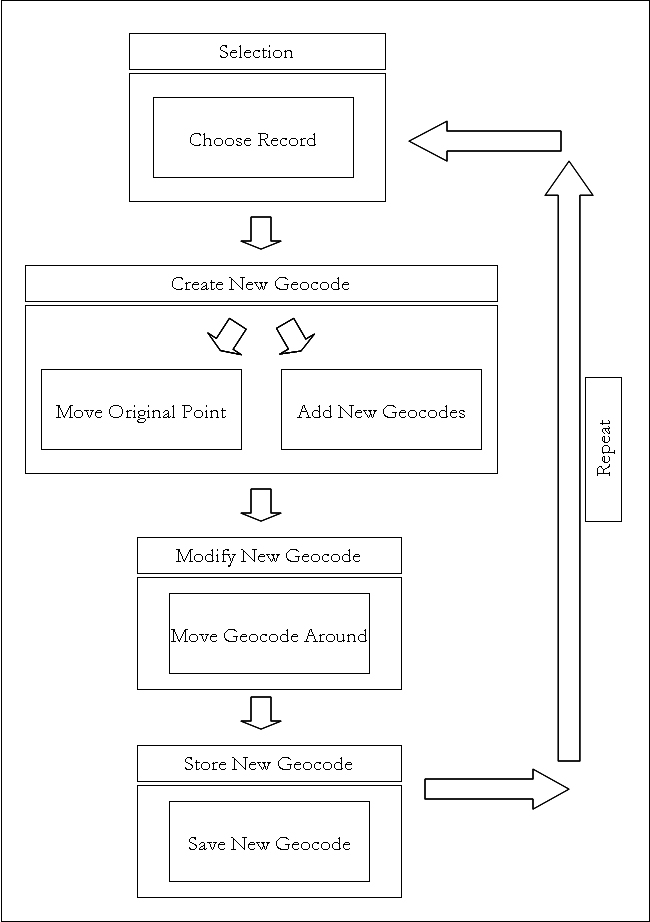
Record processing workflow
The record processing workflow consists of choosing a record, creating an updated
geocode by either moving the original point or adding new ones, moving
the updated geocode around, saving it and then selecting another record
and repeating, as depicted in the next figure. Obviously, one could choose to
leave the original geocode “as is”, and this has been excluded from the diagram.
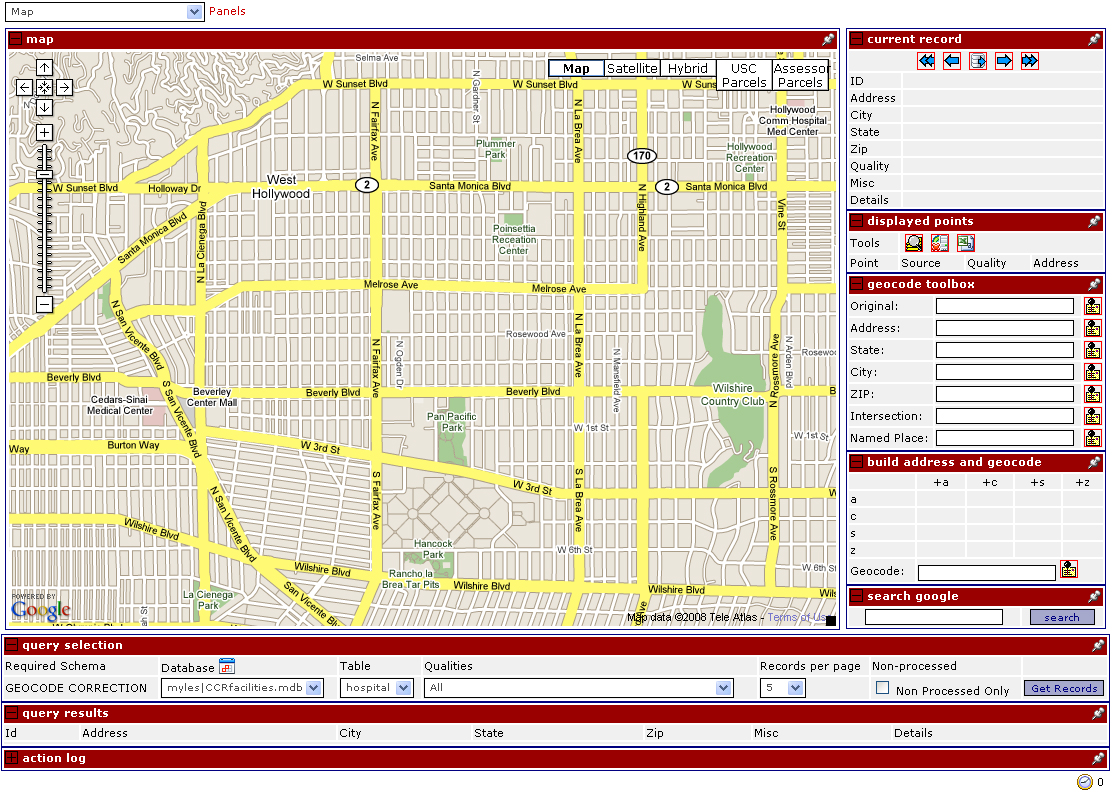
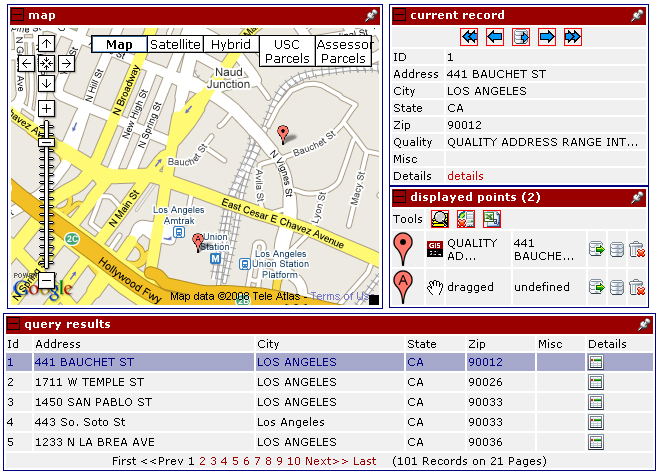
User interface
The user interface of the Geocoding Correction Tool has
been developed as a webpage and is displayed in the next figure.
It is composed of three main sections: the map (top left),
record selection (bottom), and current record display, visible points,
and other tools (right).
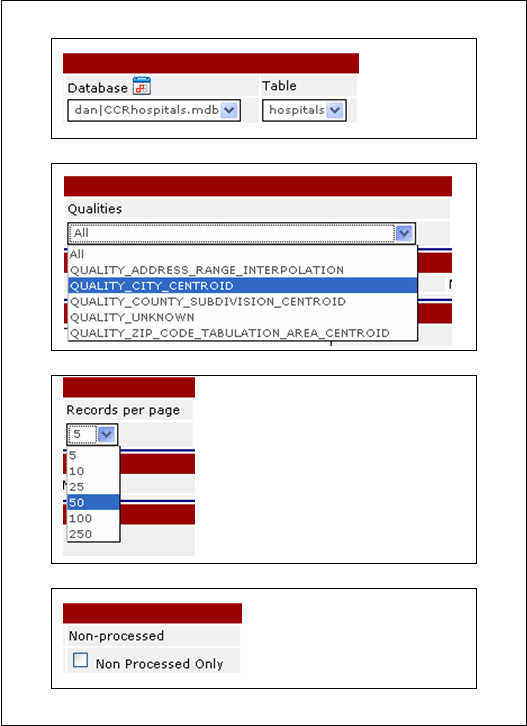
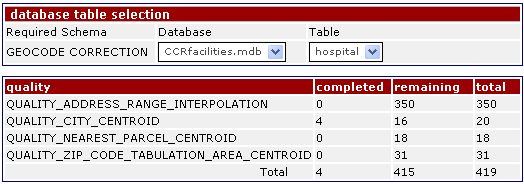
Query selection
A user performs a query to select records for processing from the
database using the query panel, the components of which
are displayed in the next figure.
The Geocode Correction Tool allows the user to select records to work on based
on classes of qualities. In the Geocode Quality Panel figure
only records with quality “QUALITY_CITY_CENTROID” (in this example database table)
will be selected and displayed.
The qualities present in this dropdown will be a list of the unique
qualities within the input database table (i.e., the result of a
“SELECT DISTINCT (qualities)” SQL query on the input table). These
will be specific to the geocoding engine used, with each geocoder
possibly outputting different classes of coordinate qualities. In the
present version, these qualities must be a field in the input table.
The user can choose the amount and type of
records (e.g., non-processed only) to display per page on the panel in
the figure.
Clicking on the database details icon will show a page displaying
the statistics about the selected database including the total,
completed, and remaining number of records broken down by quality type,
as shown in the next figure.
Records panel
After clicking Get Records, the number of records selected will be
displayed on the Records Panel as in the next figure, with the currently
selected record highlighted in orange. The records can be sorted by
the column headings by clicking on the appropriate heading. The pages
or records can be scrolled through by clicking on the First, Prev, Next,
and Last buttons or the page numbers below the records table. Clicking
on a record in the list will select it and load it into the current record panel.
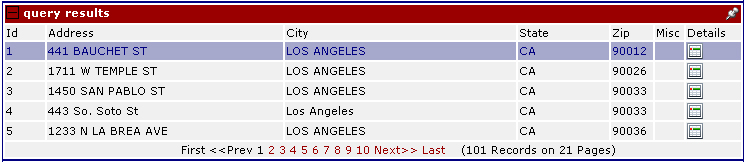
The details icon will open the details page shown in the next figure,
from which all processing information associated with ca record can be reset.
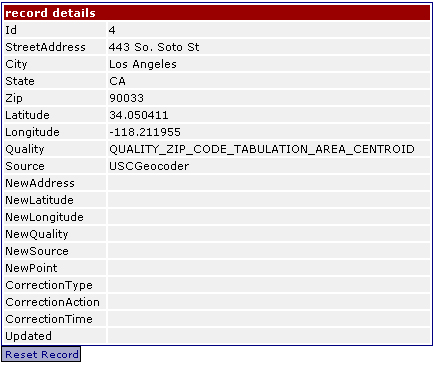
Current record panel
When a record is selected, its information will appear in the Current
Record Panel and its associated geocoded points will show in the Map Panel,
as shown in next figure.
The Current Record Panel alone is depicted in next figure, which shows the information
associated the current record.
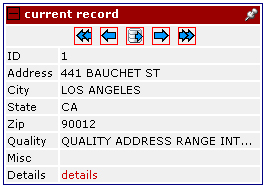
From the Current Record Panel, the user can navigate to the First, Prev,
Next and Skip, Next, and Last records by clicking on the corresponding button,
as depicted in 5 images in the next figure, respectively.
The Next and Skip button should be used when a record should be marked as processed,
but it shouldn’t have a new geocode associated. This would be the case
when correction was attempted, but no better geocode was able to be
obtained or determined. The details link will open the same record details page seen earlier.
Add geocodes panel
The Add Geocodes Panel, displayed in the next figure allows a user to quickly
and easily add more geocodes to the Map Display. This panel is the main
area users will be working when they are correcting geocodes. This is
where users have the ability to add new data to be geocoded and placed
on the map, which can then move around and associated as the corrected
geocode for the record. To add a geocode, the user can enter a location
(named place, address, city, etc.) in the appropriate textbox and
hit the geocode icon located to the right of each textbox.

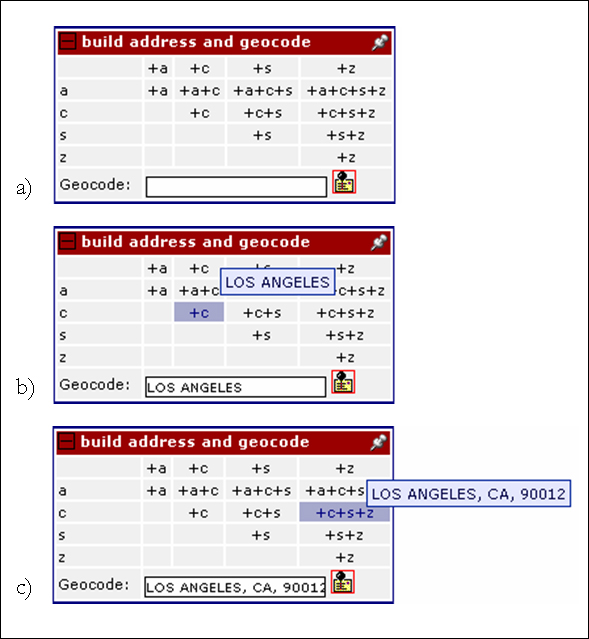
Alternatively, the user can add geocodes by using portions of the original
address easily by clicking on cells within the Build Query from Address
Table. To do this, the user clicks on a cell to add its contents to the
textbox below. The text which will be added will be displayed in a
tooltip as the user rolls their mouse over each of the cells. Clicking
on the any of the cells in the first column on the left or the top row
will add just that portion of the address as in the next figure. Clicking on
cells within the grid will add combinations of the address components. Any number
of cells can be clicked to build an address from separate components, with
each being separated by a comma as they are added to the text box.
Displayed points panel
The current geocodes associated with the record, as well as any which
are created using the Add Geocodes Panel will be listed in the
Displayed points Panel, and on the Map Panel. The Displayed Points
Panel is shown in the next figure.
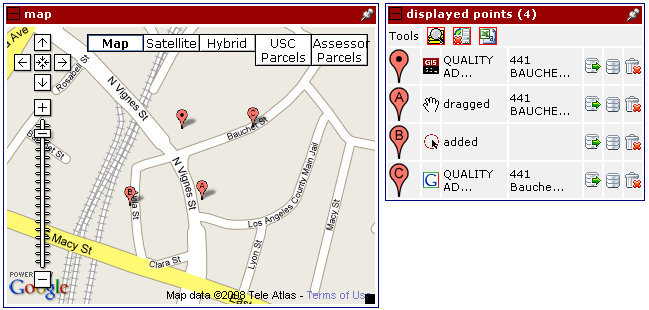
The Original Geocode associated with the record when it was uploaded is
indicated with the Original Geocode Icon in the next figure.

Any other geocodes which have been added using the Add Geocodes Panel will
be listed in alphabetic or of their creation as in the next figure. To zoom to a
particular point, click on the marker icon in the displayed points list.

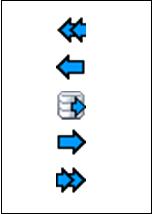
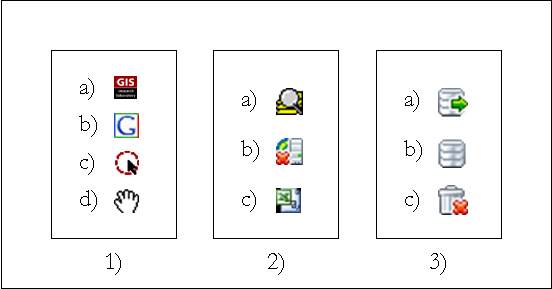
The icons in the next figure are all related to the added points table.
The icons in 1) are the indicators that show how a point was
created. 1a) is a point created from the Texas A&M geocoder,
1b) is from the google geocoder, 1c) is from a click on the
map, and 1d) is from a drag. The icons in 2) deal
with mapping and display operation of all of the points in the added
points list. 2a) will zoom the map to encompass all of the
points in the list, 2b) will delete all the points from the
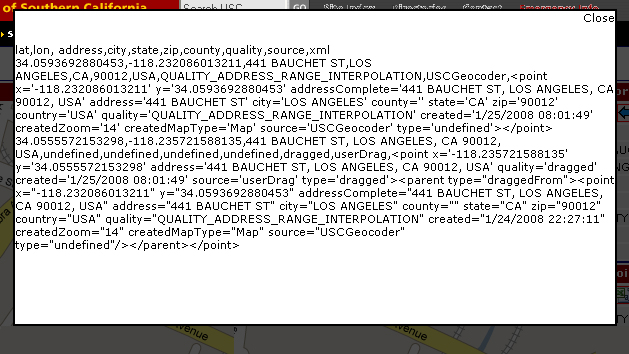
list and the map, 2c) will export all the points in the list
to an comma separated value documents which will show in a lightbox,
such as in the following figure. The icons in 3) all deal with storing
or deleting a particular point in the point list. 3a) will
store that point as the corrected geocode and proceeded to the next
record, 3b) will store that point as the corrected geocode
but not move to the next record, 3c) will remove that point
from the point list and the map.
The csv lightbox is displayed in the following figure.
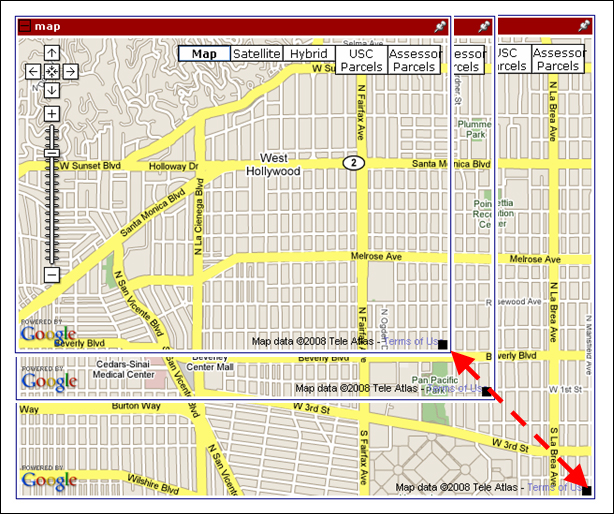
Map panel
The map panel displays a standard Google Maps interface, with a scale bar and several
layers that can be selected, e.g., Map, Satellite, etc. Each of the geocodes
from the current geocode panel will be displayed on this map. See the
Google Maps Documentation
for the basics of using the map interface (e.g., panning, zooming, overlay selection).
The small black box in the lower right corner can be used resize the
map by clicking and dragging it while holding down the left mouse button, as shown in
the next figure.
Adding points
Single left-clicking on the map panel will create a new point at that location.
These newly added points will be draggable and will be added to the list of
displayed points with the circle and pointer icon indicating it was created
from a user click.
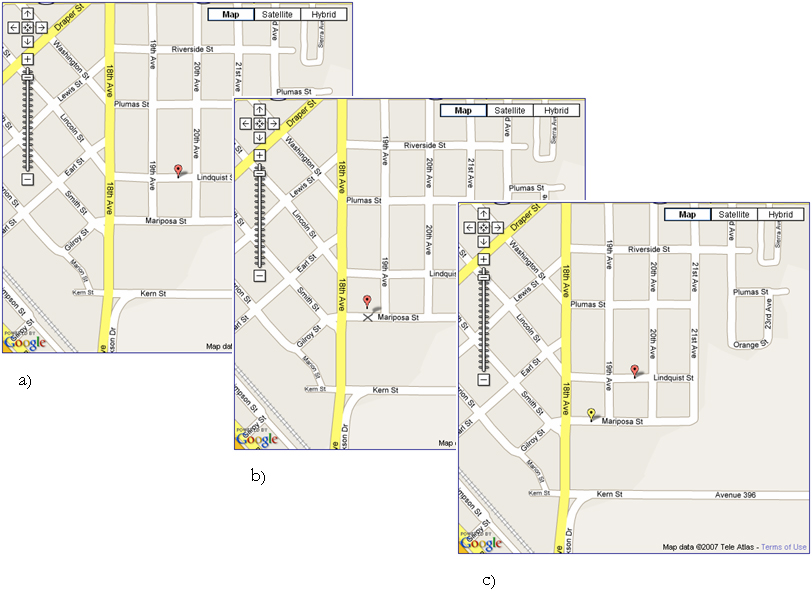
All of the points displayed on the map are draggable. To drag a point, left-click
it with the mouse, and move it around while continuing to hold down the mouse.
Release the left-mouse click to drop it to a location. When dropped, the
dragged point will be replaced with a new point, and the original geocode
will go back to its original position. These newly added points will draggable
and will be added to the displayed points list with a hand icon, indicating
that it was created from a user drag.
This progression is depicted in the next figure, with a) showing the original
geocode, b) showing the original geocode being dragged, and c) showing the
original geocode being placed with its subsequent and replacement by the
updated geocode and its return to its original position.
When a new point is added to the map via some user interaction with the map itself,
i.e., a point created by the user either clicking to generate a new point or a
dragging and dropping an existing point, the point placement rationale lightbox
shown in the next figure will appear.
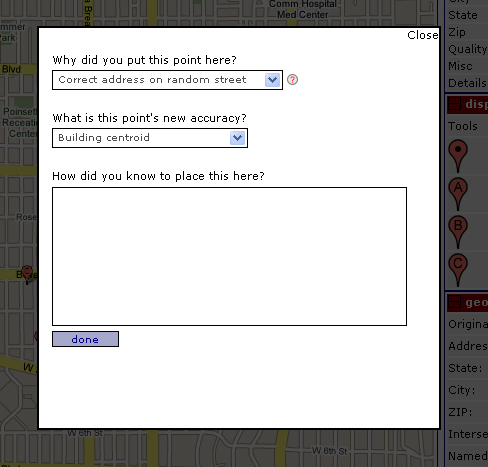
The goal of this is two fold. First, when the user creates or moves a
point (which results in a point being created), it is impossible
for the application to determine why they created it where they created it.
Thus, the application needs the user to explain why they did what
they did, in terms of which protocol steps they were following
when they created and placed the new point where they did. Clicking
on the question mark icon will bring up a page with the descriptions
and scenarios when each of the “Why did you put this point here” list options should apply.
Second, it is also impossible for the application to determine
the accuracy of user-created points. Thus, again, the user must
tell the application what the expected level of accuracy for
this newly created point should be. Depending on what the user
selects in the “Why did you put this point here?”, in most cases
the answer to the “What is this point’s new accuracy?” question
will be automatically selected.
The textbox under the question “How did you know to place this here?”
should be used in the following cases:
-
In cases where a specific protocol does not apply but some other method found a correct location - do the following:
i) Choose the closest answer to question (1) - why did you put this point here?
ii) Choose the closest answer to question (2) - what is the new point’s accuracy?
iii) Enter you rationale for placing the point where you put it
-
In cases where a google search resulted in extra information - do the following:
i) Choose “Searched google for more information” for question (1)
ii) Choose the closest answer to question (2) - what is the new point’s accuracy?
iii) Enter the information that you discovered while searching google that led you to put the point where you placed it
When finished identifying this information, click the done button to
return to the normal Geocoding Correction Tool
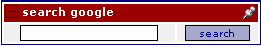
Search Google panel
The Search Google panel should be used for
initiating searches to the google search engine. The user should type
their query into the text box and hit the search button, as displayed
in the next figure.
Upon hitting search, the results from the google search will be
returned in a lightbox. Each of these results can be clicked on
and will open a new browser window. When finished investigating the
results, click the close link on the top right corner of
the lightbox to return to the geocoding correction tool.